
You may have heard that Google is going to start using a new set of performance metrics to assess and rank websites in June 2021. It’s the first big algorithm update for a while and the digital world is full of chatter. We’re here to cut through the noise and tell you what you need to know.
Ultimately, it’s time to pay attention to Google, chat with your digital marketing agency and start an ongoing conversation with your developer.
What is the Core Web Vitals update?
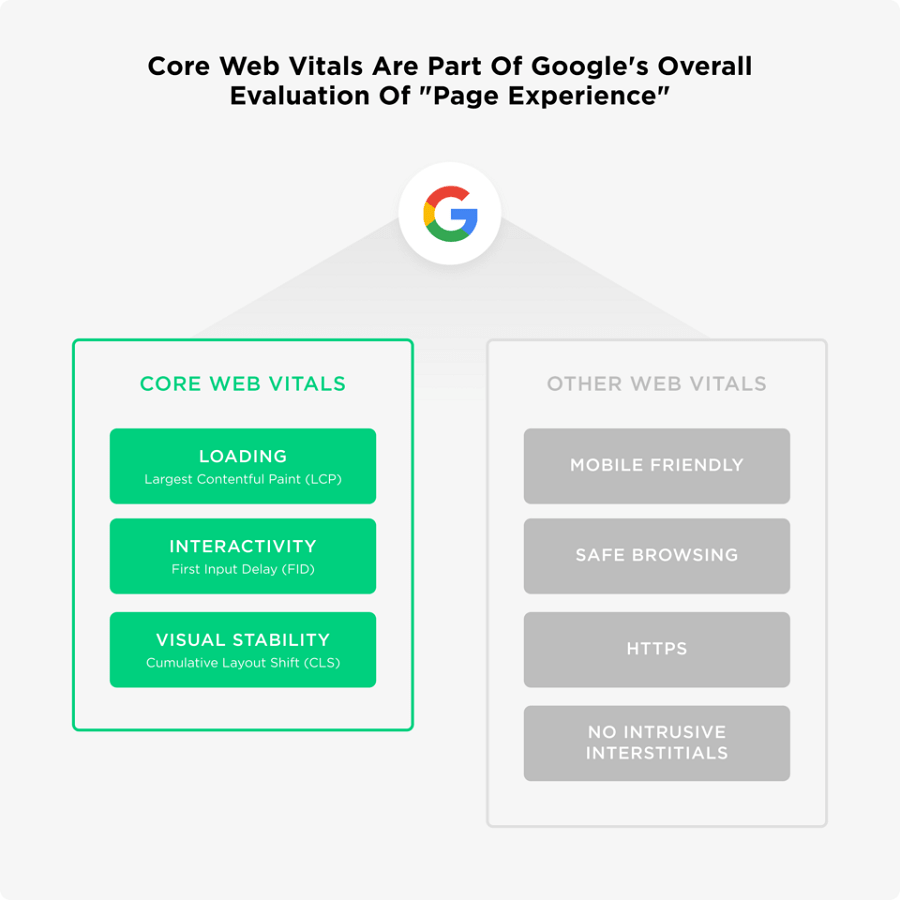
The Core Web Vitals update relates to a set of three user experience factors Google will now use to rank websites.
Google uses over 200 ranking factors when it appraises websites. With the Core Web Vitals update, speed, interactivity and page stability will be added to the mix. These metrics will be combined with existing UX signals to measure a user’s experience of a page. Known as Page Experience, this is what the June 2021 update will focus on.
But how important is this change? Well, picture this: two sites are competing for the same organic search ranking. Both have content that is high quality and meets the user’s needs. But one has optimised for Core Web Vitals and has better UX. Google will likely choose to rank that site over the other in the search result pages.
Why are Core Web Vitals important?
Optimising your website for core web vitals can be a simple win in terms of improving your site for search and gaining higher rankings in the SERPS. However, delivering a good user experience can have huge commercial payoffs too. If someone can use your website easily and feel comfortable with navigating or taking action, they are more likely to convert and return. And remember, Google is focusing on experience because it wants websites to deliver better experiences for users. Better experiences should ultimately lead to more trust and more conversions.
What are the Core Web Vital metrics?
To prepare for the Core Web Vitals algorithm update, you first need to understand what they are and how to optimise for them.
Core Web Vitals are a set of web vitals which offer guidance on what’s needed to create a great user experience. The three metrics that make up the Core Web Vitals for 2021 are:
- First Input Delay
- Largest Contentful Paint
- Cumulative Shift Layout
It is worth noting that you don’t need a good score for all three metrics.
How to measure Core Web Vitals
Core Web Vitals performance can be measured through a range of tools including Chrome Dev Tools, Google Page Speed Insights, Lighthouse and Google Search Console. The best way to get an overall view of your site’s CWV performance is through Google Search Console as this will display the type and extent of each issue and the affected URL(s).
You can then use Lighthouse and Chrome Devtools for a closer inspection of the page and find out what exactly needs improving.
Finding and fixing CWV issues can be slightly technical if you don’t have much experience so it’s best to enlist the help of a developer to carry out some steps. To find out more about how you can optimise for these core metrics, keep on reading to hear our tips.
What is First Input Delay (FID)?
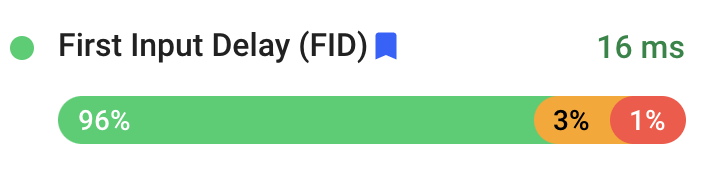
First Input Delay tracks the time from when a user first interacts with your site to when the browser responds to that reaction. It’s slightly similar to the page speed metric, but FID is all about the actions a user may take on your site. Essentially, it measures the delay between tapping on something on the page, to when that action is processed.
First Input Delay examples include:
- Selecting a page from a navigation menu
- Clicking on a link within the site
- Enlarging an image
Google considers FID as an important factor because it helps measure the experience users have when interacting with elements on a website. Ideally, you want a low FID, as this tells Google that the page is usable and responsive. A good threshold is the 75th percentile of page loads divided across both desktop and mobile devices.
How to improve First Input Delay
There are many things you can do to optimise First Input Delay, and most involve the Javascript on your site. FID is something you want to keep to a minimum, so it’s important to remove any unnecessary elements that could worsen a user’s first impression of your site.
So what sort of elements should you be looking out for?
Images
Images can take up a lot of space on a page, leaving less room for processing other elements. To help reduce FID, consider applying lazy loading to images.
Many aren’t sure about lazy loading because they believe it goes against a user experience. This could be because the placeholder isn’t attractive enough for the page, or it takes a while to load the image. To tackle these concerns, try taking the dominant colour from that image and using it as a placeholder. Another option is to use a lower quality, slightly blurred image in its place. This gives the appearance of loading time, and can give a user an idea of what the image looks like before it’s fully processed.
If you’re still not a fan of lazy loading, or you still need to meet the Core Web Vitals threshold, then you can also try reducing image sizes and dimensions.
Third-party codes
Third-party codes, such as cookies, can affect loading times as they add more noise to the networks. If there are unused codes that aren’t offering much value to the user, consider either delaying them or removing them entirely.
Unused code
Any code applied to a page is another element that your browser’s “thread” (processing power) needs to execute. By reducing that time, the browser can instead focus on processing the user’s actions on the page.
When a Javascript file is added to the website, browsers need to pause, download the file and then execute the code. This adds more time for processing that may not be needed, depending on the code’s purpose. To reduce the time spent on Javascript, cut down on anything unused, as well as third-party scripts.
Large Javascript bundles
Bulky Javascript payloads can take a long time to load if they’re too large. The issue with this is that the elements on the page cannot load before these packages have. These bulky files may hold up everything that needs to load. Consider reducing the size of these files when possible, or splitting the code into smaller bundles.
Non-minified and compressed code
Another way to improve Javascript execution is to minify the files. Non-minified Javascript again takes more time for the browser to process, slowing down the loading time. Minify the files to remove unnecessary parts of the Javascript code, such as white space, line breaks and comments.
Compressing the Javascript is another thing you can do to improve First Input Delay. Compression will rewrite the binary code within a file, reducing the size to make it easier to execute. The smaller the file size, the quicker the loading time will be.
What is the Largest Contentful Paint (LCP)?
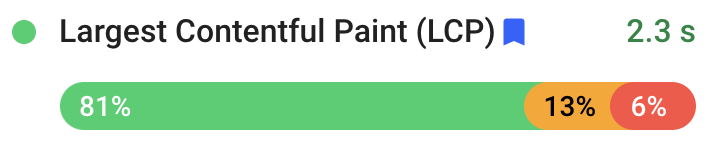
Largest Contentful Paint measures how long it takes for the largest element on a webpage to load for the user. Google only considers elements above the fold for this metric – elements that you don’t need to scroll down to see.
These elements could include:
- Images, including background images
- Videos
- Textual elements such as header tags and paragraphs
LCP is an important metric as it indicates when the main element of a page has loaded. The time it takes for that element to load indicates to the user that this page has valuable information. A good Largest Contentful Paint time is 2.5 seconds or less.
How to improve Largest Contentful Paint
There are several things you can do to improve LCP. Slow loading time can force users to bounce from your site out of frustration, so it’s essential to improve and maintain a good score.
Image size
Images are often the largest element on a page, including hero images, carousels and banners. The first step to reduce LCP time is to only use images if they’re absolutely relevant to the page and its aim, so don’t use images to excess if not required. You can also optimise and compress the images to reduce their size without losing their quality.
Unused Code
As is the case with FID, unused code can hinder loading time for certain elements. Anything that isn’t used or relevant for a particular page can slow down the browser instead of allowing it to focus on the more important features.
Remove any unused CSS or Javascript files if they’re unnecessary, or move them to a separate stylesheet if the code is being used on a different page.
Non-minified and compressed code
CSS and Javascript files can contain unnecessary characters, such as white space and indentation. Minifying files will reduce the size, speeding up the loading process and the time it takes to fully render the content on the page.
What is Cumulative Layout Shift (CLS)?
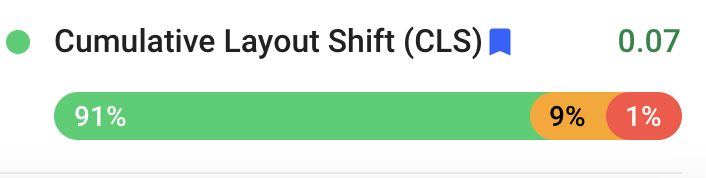
Cumulative Layout Shift is a metric which measures visual stability. Think of those times when you’re reading an article or about to click on a link in a page and elements on the page move. These page layout shifts mean that you’ve now lost your place in the article or you’ve clicked on something that you didn’t intend to. This is an example of poor visual stability.
CLS measures the largest bursts of layout shifts. This is when one or more layout shifts (when an element suddenly moves on the page) swiftly occur, with less than one second in between each shift. This lasts for five seconds maximum. The largest layout shift is the session with the highest cumulative score of all layout shifts within that window.
The elements that tend to shift on the page are:
- Images
- Videos
- Contact forms
- Buttons
It’s important to minimise CLS as it’s a reflection of poor user experience. Elements that move around on the page as it loads can interfere with the user’s actions and prevent them from finding what they’re looking for. It’s also incredibly frustrating for the user and can result in a significant number of site bounces and lost conversion opportunities.
CLS is calculated using formulas related to the amount of movement an element shifts in proportion to its own area and the page. This can get quite in-depth, so it’s best to use Google Search Console to monitor overall CLS score. You should be aiming for a CLS score of 0.1 or less.
How to improve Cumulative Layout Shift
Google has listed reasons why CLS can occur. These include images and ads without dimensions, web-based fonts and dynamic content. Cumulative Layout Shift is a real barrier to providing good user experience so it’s essential to work with your developer to isolate the causes and reduce the score as much as possible.
Undefined Images
Developers often use CSS to resize images so they take up maximum width available on the mobile device. This means that the browser needs to download the image first, so it can decipher its dimensions and allocate space on the page. If this is the case with multiple visual elements, the page will likely shift around as it loads.
Your developer should ensure that all image dimensions are clearly defined in the image tag so the browser spends less time determining the size, and can clearly reserve its space within the layout of the page.
Cookie Bars
GDPR cookie plugins can contribute towards a poor CLS score, as certain elements can stack on top of one another. Try looking for an alternative, more lightweight GDPR plugin instead.
Web fonts
Downloaded web fonts are one of the harder aspects of CLS to diagnose. The main issue is when a downloaded font is a different height and width, or length of the paragraph, to the fonts within the system. While the browser processes the size of this font, they will also use the dimensions of a fallback font to set its space on the page. This leaves a brief flash of unstyled text (FOUT) on the page as it loads.
There are a few tools you can use to help rectify this, such as font:display, which will show a system font temporarily. You can also use the Font-Display API, which specifies how a font is displayed.
Five things you should know about the Core Web Vitals algorithm update
- Don’t panic. According to Screaming Frog, only 12% of mobile results met the Core Web Vitals benchmarks. As for desktop results, only 13%. The best thing you can do is start to fix any site issues mentioned above.
- Look at Search Console reports. These reports will help identify the elements hindering your Core Web Vitals score, so you can prioritise these fixes. You can also look at Lighthouse and Chrome Devtools for more information.
- Speak to your SEO agency. If you’re not feeling confident about the update, or are unsure about the next steps, then an SEO agency can run a Core Web Vitals check and offer guidance to help your site achieve a good score.
- Speak to your developer. Much of the work needed for Core Web Vitals can be looked at by your web developer. They will have the expertise required to apply the required fixes.
- Don’t go over the top. If your site is already at the ‘good’ threshold, you don’t need to optimise for a few extra milliseconds. To Google, the ‘good’ threshold is a pretty high bar.
We can help you with your Core Web Vitals score
At Loom, we’re working closely with our clients and their developers to ensure they’re fully prepared for when the update rolls out in June. If you feel that your business website isn’t up to scratch, then get in touch with us today. Our team of SEO experts will provide you with the help you need.